v6.1: Smarter Game Embeddings, a New Uniqueness Score & a Rebuilt Steam Map
Share:

An Epiphany on a Train
I don't tend to talk about our personal life much. Game Oracle is built by myself and my wife; I do the data and tech whilst she manages all the marketing, business, admin, and to be frank keeps the ship on course. But we're not funded, this business is 100% bootstrapped and we keep the lights on with contracting gigs which occupies most of our time right now. It's a small price to pay to keep the dream alive and we have big dreams, so we just find a way to make it work.
I'm a contract data scientist and every so often I have to travel into London for my work. It offers me an opportunity to reflect — train journeys have a certain way of cultivating that. On one particular train journey about 3 weeks ago I had an epiphany. I've been revising everything I know about representation learning because, despite a PhD and several years of applied experience, the self-doubt never really leaves you. It's always keeping you in check. I'm glad it does because I had a certain realisation about what we're doing here at Game Oracle.
Representations
The centerpiece of my work around understanding the Steam market is "How can I mathematically represent the similarity between games?". I spend an ungodly number of hours thinking about this, because it unlocks so much potential. To represent something mathematically means we grant some complex high-dimensional entity (in our case a game) geometric meaning — a lot of words to unpack there:
- What do I mean by high-dimensional? Every game has attributes: it's themes, mechanics, the genre it occupies, it's visual style, the player perspective...I could go on an on. Each attribute, each tiny slither of information and the factors behind what derives that information, forms a dimension that we can either measure or estimate.
- Geometry? Yes! Think back to high school maths. If a game only ever had two dimensions we could measure — let's say "Number of boss fights" and "Number of levels" (gross over simplification, but stick with me) — we could measure the similarity between two games by measuring the distance between those games in two-dimensional space. We can do the same thing even when we have thousands of dimensions that represent "what a game is".
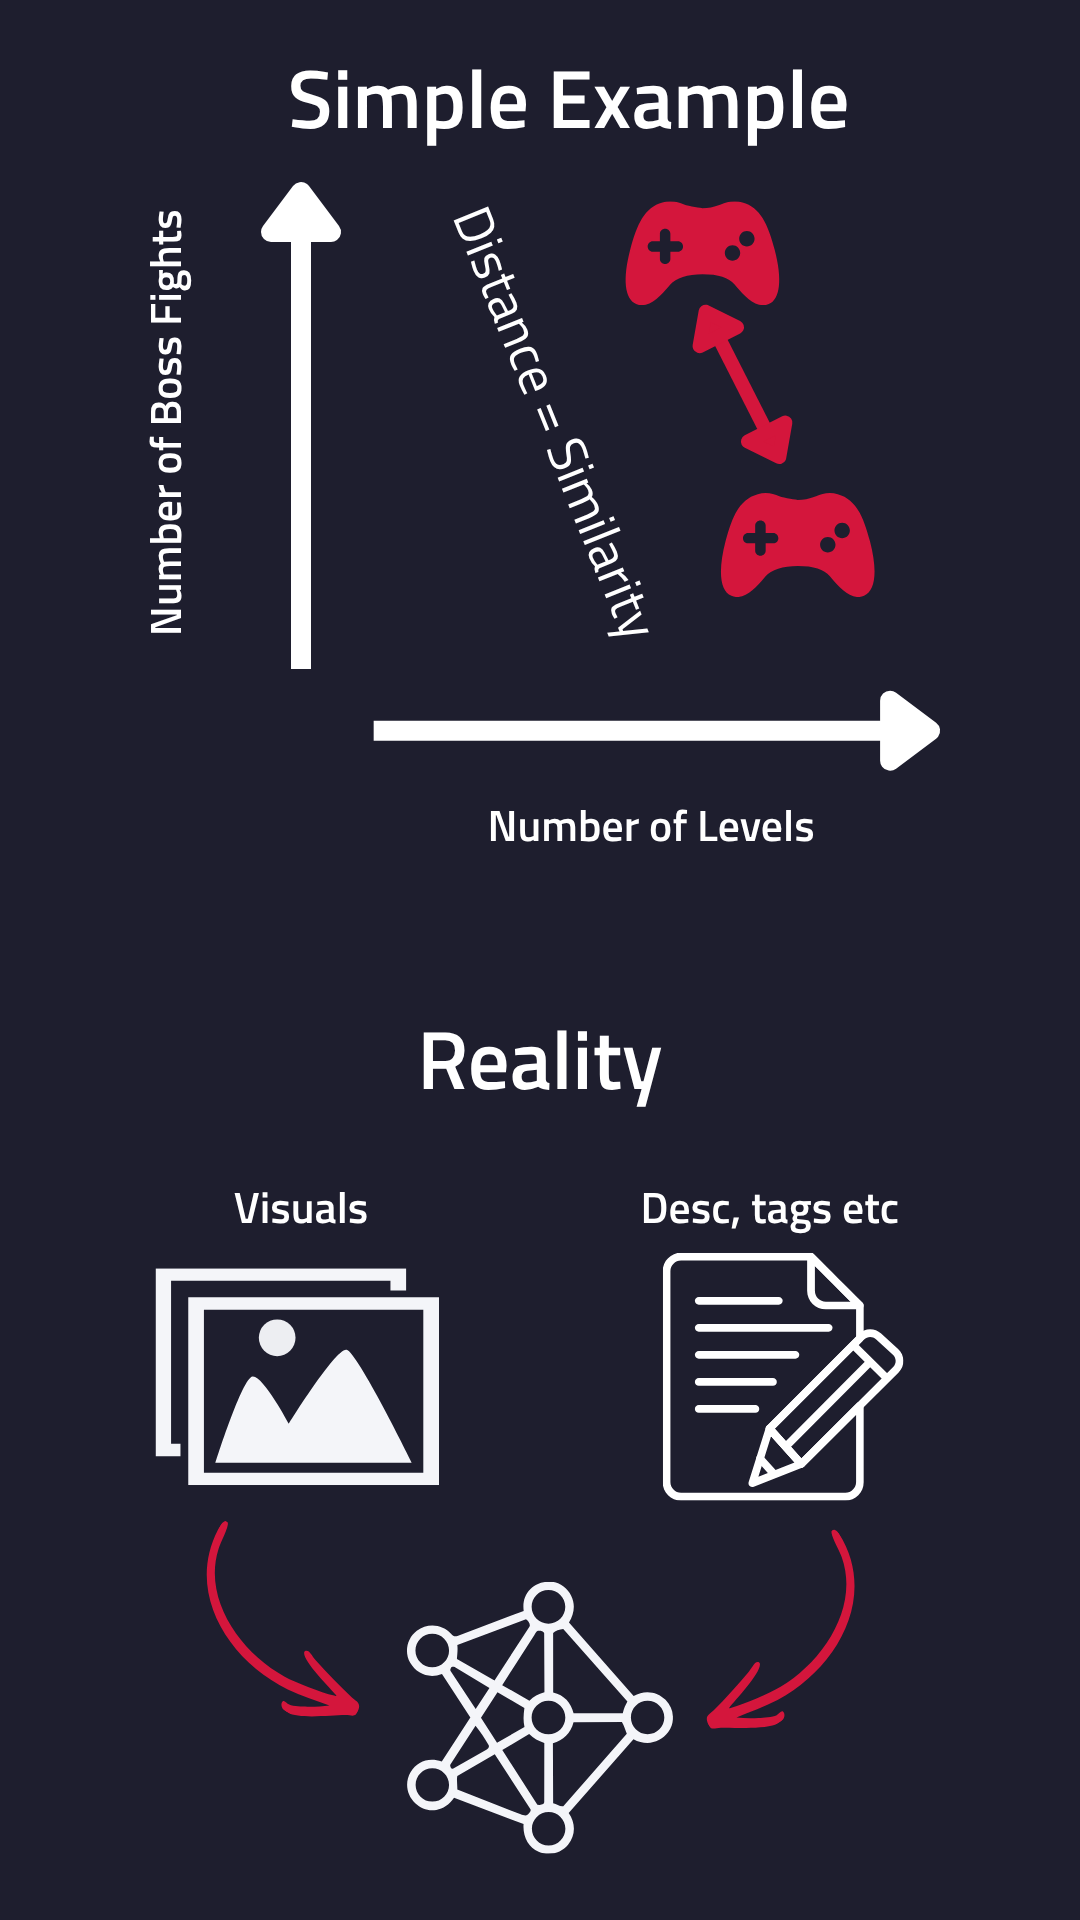
This geometry is critical because it helps us answer questions like:
- Are there any similar games to my concept? What did they include in their game? How well did they perform? How did they market it?
- How saturated/dense is the market around a particular concept?
- Are there any "empty" or "undersatured" areas of the market with players looking for games?
- What ideas seem more unique? How much "space" is there here?
That last idea, the question around "space", that is what has haunted me. You see, although it is possible to measure the distance between games in high-dimensional space, measuring density is actually extremely difficult. Things get weird in higher dimensions. Like in Ant Man when they go into the Quantum Realm, everything is topsy turvy. Almost all the space piles up out near the “edges,” so shapes like spheres and cubes stop behaving the way our 2D and 3D intuition expects them to. It means market density can be very misleading.
A Better Way
On the train that day I had a breakthrough. I realised two things at once:
- We can represent each game more accurately with a new type of model — a custom built variational autoencoder with a very particular design that allows the visuals and text descriptions of games to work together.
- The way we present this to our users can be greatly improved. Reducing the chance of misrepresenting the data.
This culminated in the release of v6.1 which also prompted a much needed rebuild of the Steam Map, our 2D visualisation of the entire marketplace. I'll speak to point 2 above in more detail and then we can get into some examples of how the Steam Map has changed.
Uniqueness Score
In previous versions of Game Oracle we provided a "Saturation Score" for each title. A measure of how saturated the market is around each game. It had a range of 0 to 10, with higher values indicating that the game sits in a more saturated market. The problem is, it wasn't very accurate or stable; when we added new games to our dataset our global estimate of density (which was poor due to the wackyness of high dimensions) caused Saturation Score to change wildly.
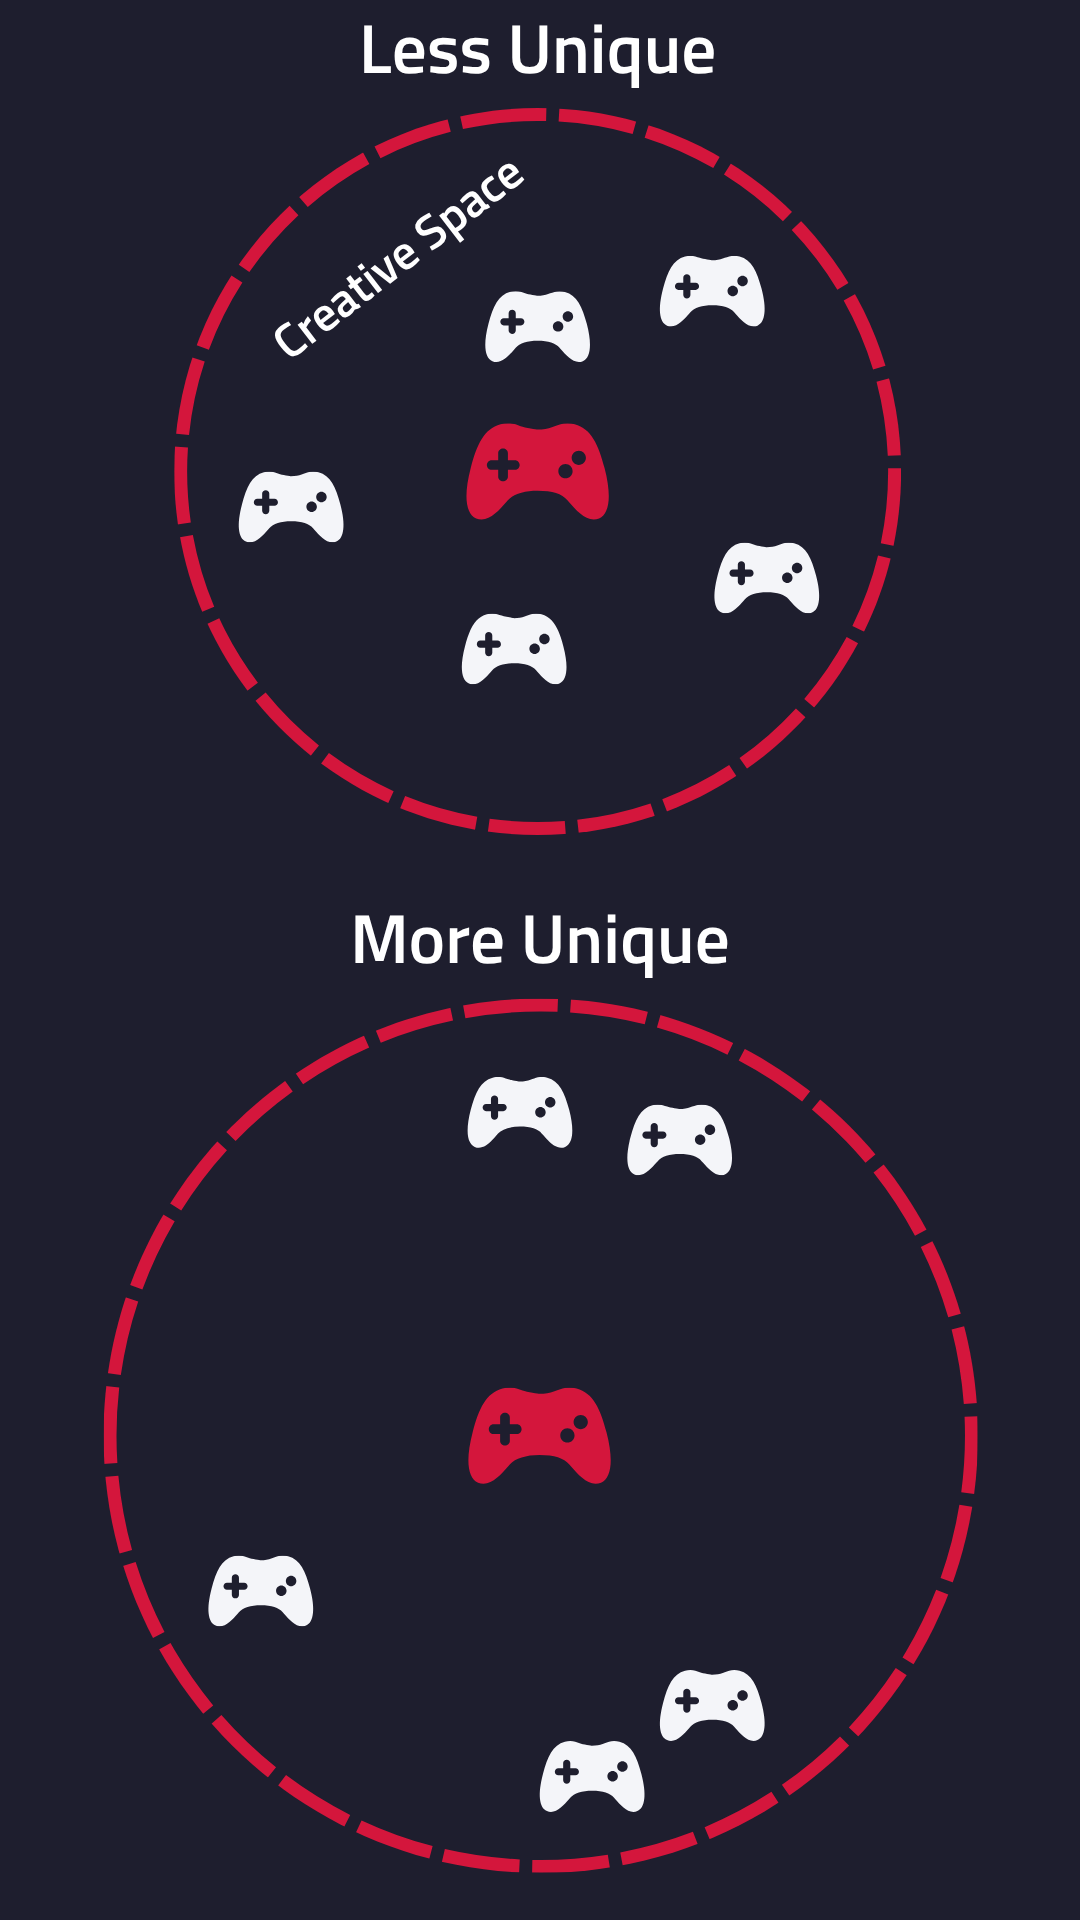
The solution was to use a better model that could project our data into a lower dimensional space without losing information and measure "uniqueness" instead of "saturation". Why are they different? Our Uniqueness Score now measures the average distance between the 20 nearest competitors. It is quite literally that. It is a measure of how much "creative space" exists between a game and it's direct competitors. Emphasis on direct. A game can exist in a saturated genre (like Co-Op Horror games) and still be unique. It is all about the local space around that game.
The Uniqueness Score is measured between 0 and 10, with higher values indicating a game is more unique than it's closest competitors.
Saturation in 2D
You will still be able to view market saturation in our Steam Map tool. The Steam Map "squeezes" all our data into a 2D projection, placing all the games on Steam into bins of similar games. This is amazing because it means we can visualise and explore the entire marketplace in a single interactive plot. However, it is not as accurate as our Data Explorer, Game Gap, and Concept Compass tools which uses all the dimensions available; all that squeezing into 2D loses information.
So what is the Steam Map good for? It allows you to visualise, broadly, the market saturation in genres and sub-genres. It gives you a global view.
But saturation on the Steam Map is fundamentally different to Uniqueness Score, because Uniqueness Score measures "How unique is this idea when we look closely at it's own little corner of Steam?".
Steam Map Refurbishment
Classic scope creep. Whilst I was rebuilding the models I had the urge to just completely rebuild the Steam Map and address some issues people consistently bring up. Originally we were using Apache ECharts because it allowed me to move quick without worrying about the interactive elements.
But we seem to have hit its limits. It was time to go all-in and build a custom 2D heatmap using D3.js
The Steam Map now includes a number of features our users have been requesting for a long time:
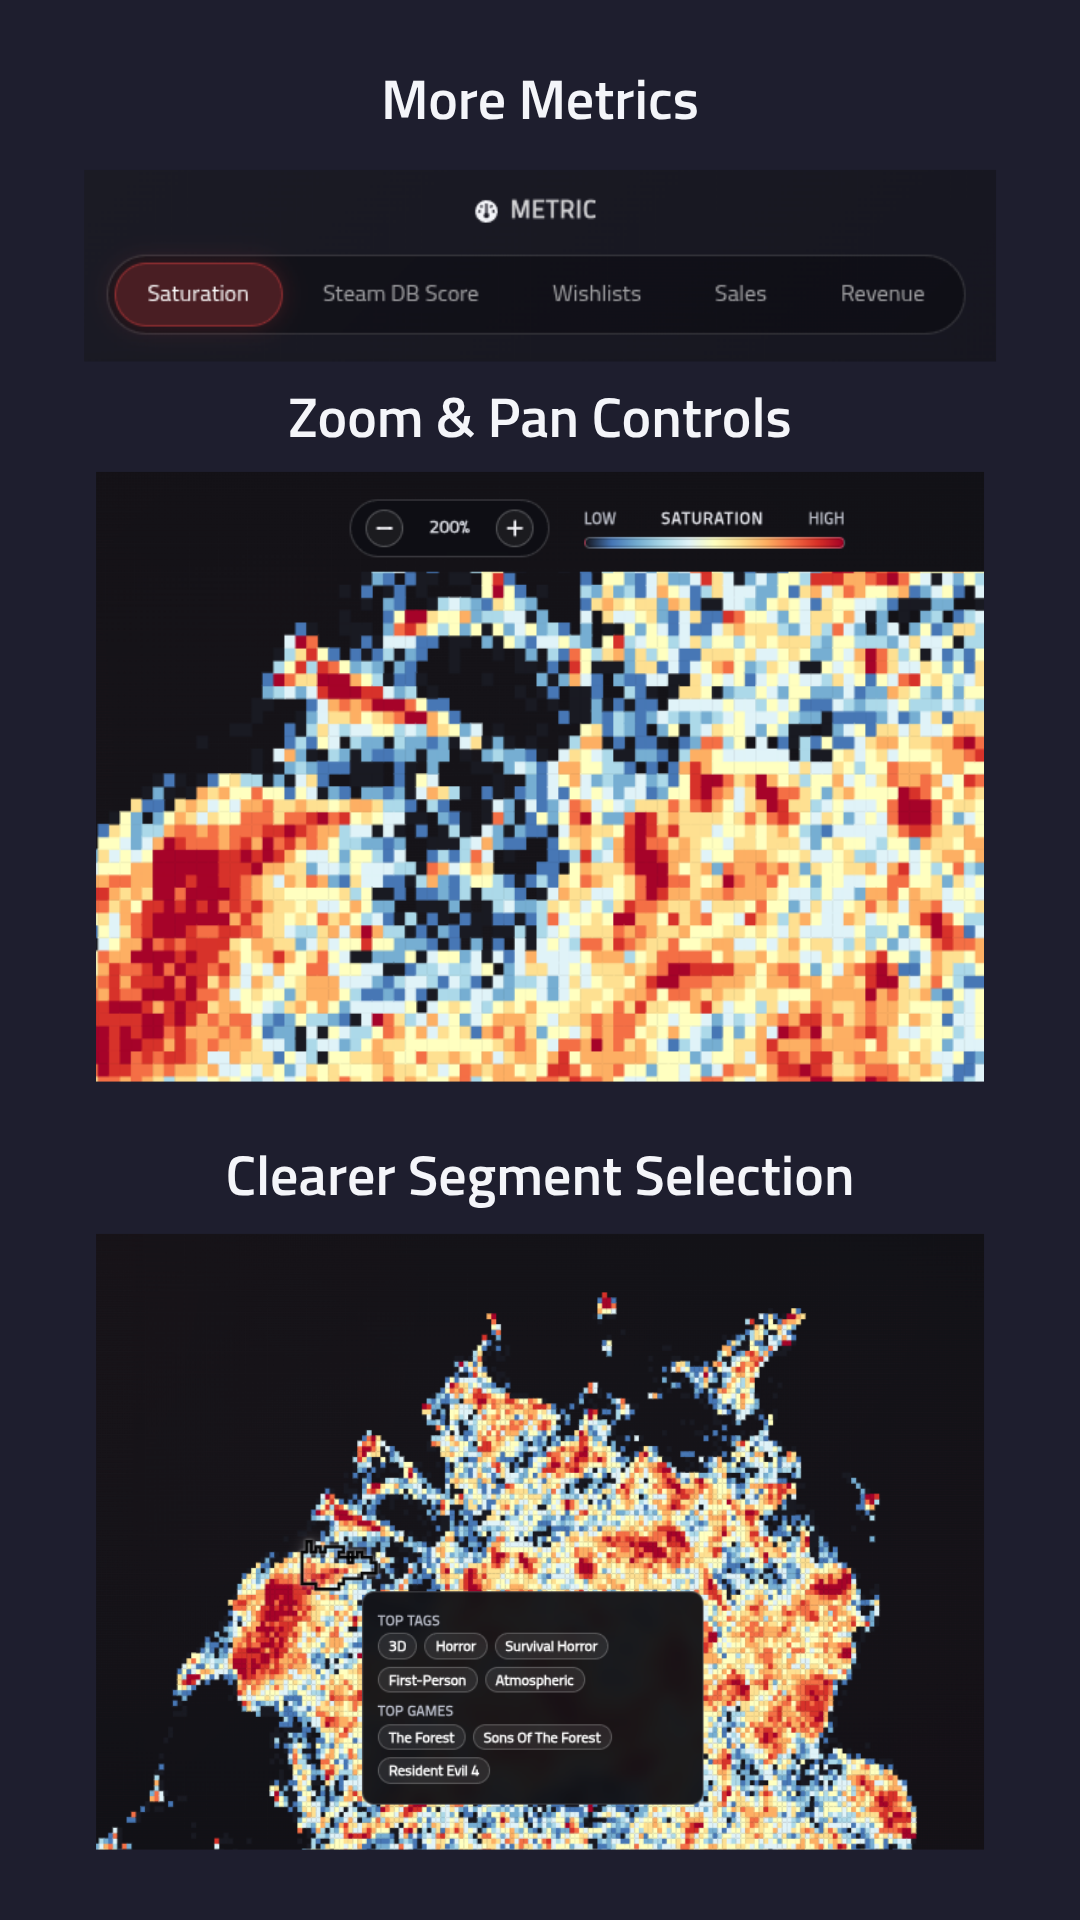
- Zoom functionality: you can now zoom in and out of the map
- More natural selection tools: I've run a clustering algorithm over the map itself, so when you hover over the map games are naturally clustered together with a nice preview of popular tags and titles, helping to understand the contents of each segment
- More stats: you can now visualise not only market saturation but also Steam DB score, estimated sales, estimated wishlists, and estimated revenue.
What Next?
With v6.1 released we can begin to focus on our longer roadmap. Our goals with the business are to:
- Become the most affordable and reliable platform for market research for indie game devs and publishers
- Help indie's develop sustainable businesses that serve real market niches
- Address some of those market niches ourselves with our own indie studio (the reason we started all this in the first place!)
To do that we need to make our data collection and processing more reliable. This will probably be what I'm working on all summer. We also have an ambition to improve our sales and wishlist estimates, which will likely be my next immediate focus.
We hope you enjoy the v6.1 updates and if you have any issues at all you can always reach out to use directly on Discord.
You can also stay up-to-date with all our latest market research insights by subscribing to our free monthly newsletter!