Game Oracle v7.1: More data!
Share:

Hey all and greetings from Chiang Mai! Jennie and I have just been to Gamescom Asia and we're sticking around in Thailand for a while to avoid the brutal European winter!
We've been busy exploring and learning about the game dev scene in Asia, but that doesn't mean we haven't been hard at work trying to improve Game Oracle. Today we're shipping v7.1 and the main addition to this release is simple: more data!
So let's get into it and cover what is shipping in this new update.
Proven Pioneers & Missed Opportunities
Something has bothered me for a while about Game Gap. Some games on Steam are so distinctive that they’re difficult to place fairly within a specific market segment. Sometimes, a single game feels like a niche of its own.
These games receive high uniqueness scores on Game Oracle because they occupy sparse regions of our Steam Map, with fewer close alternatives and more “creative room” around them.
Until now, I think we’ve been too rigid in how we identify promising opportunities. Our segment analysis looks for groups of games that collectively demonstrate demand. That’s useful evidence, but it leaves a blind spot: what happens when an interesting idea has only been explored by one or two games?
If we force those games into broader clusters, or leave them out because they don’t fit anywhere neatly, we risk losing the very signal that makes them interesting. Requiring a niche to have lots of examples means we may only recognise it once plenty of developers have already explored it.
Steam’s uneven distribution of success makes those outliers especially worth studying, something we discuss in our video about what predicts indie success. A single hit doesn’t prove that another game can repeat its success, but it deserves a closer look.
So we’re adding two new ways to explore Game Gap:
- Proven Pioneers: distinctive games that have found an audience and earned strong reviews. They help us explore what players love about an unusual experience, and where there might be room to take it further.
- Missed Opportunities: distinctive games that attracted players but received weaker reviews. They help us investigate what disappointed that audience, and whether there’s an opportunity to serve it better.
Each game comes with a report exploring its unique hook, player feedback, marketing opportunities and development challenges. The review analysis separates what players enjoyed, problems with execution, and concerns about the underlying concept. For Missed Opportunities, it also highlights sampled reviews where players explicitly praise the idea but criticise its execution.
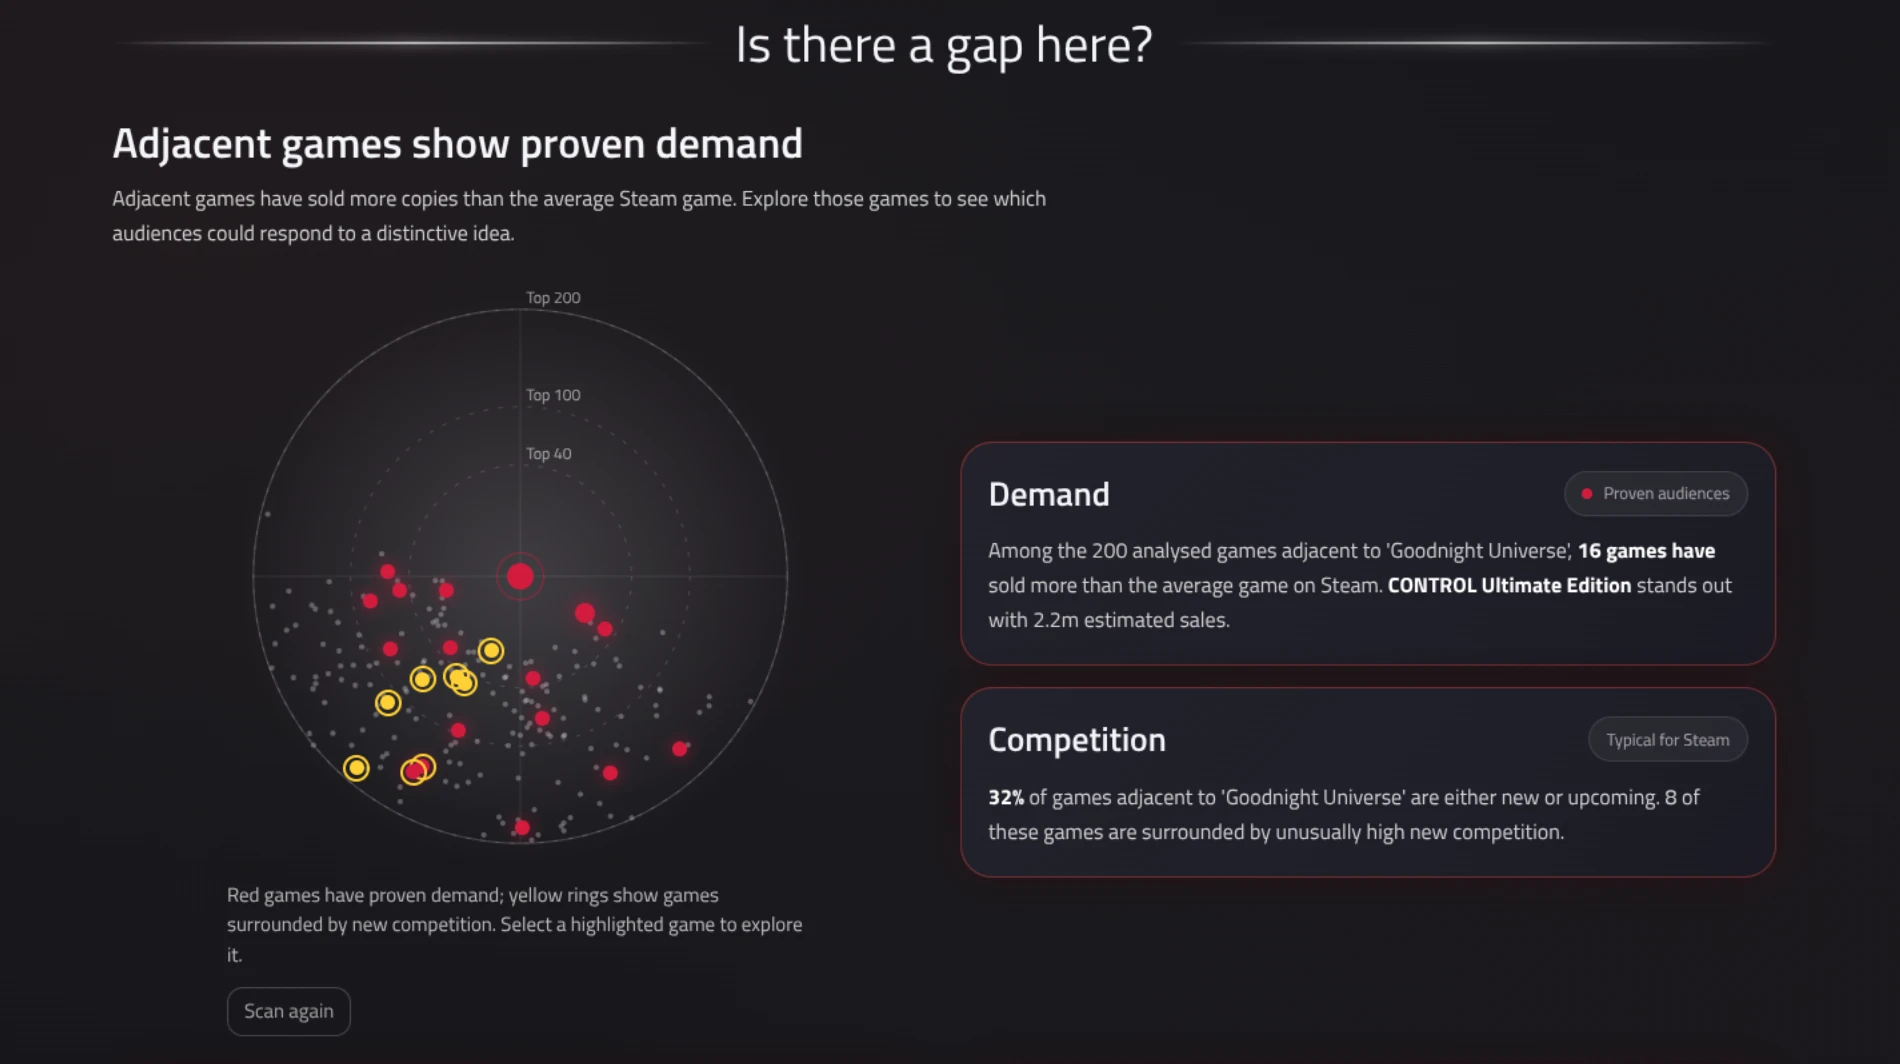
We also examine the 200 most similar games to look for demand in adjacent markets and signs of growing competition. Even when there are few close substitutes, those neighbouring games can suggest audiences to explore and interesting combinations of ideas.
Both lists surface potential opportunities to serve an audience with few close alternatives. Uniqueness alone doesn’t establish demand, and disappointed players don’t automatically imply an easy fix. These reports give you evidence to investigate those possibilities.
Game Gap now makes room for opportunities that haven’t yet grown into recognisable market segments. Sometimes, one unusual game is enough to give you a worthwhile lead.
Time-to-Complete Estimates
We’ve added time-to-complete estimates in v7.1, helping you understand the scale of comparable games and what that could mean for your own development budget.
When investigating a concept, potential revenue is only half the picture. You also need to consider what it might cost to deliver the experience players expect. A promising market can look very different if comparable games typically offer 50 hours of gameplay rather than 5.
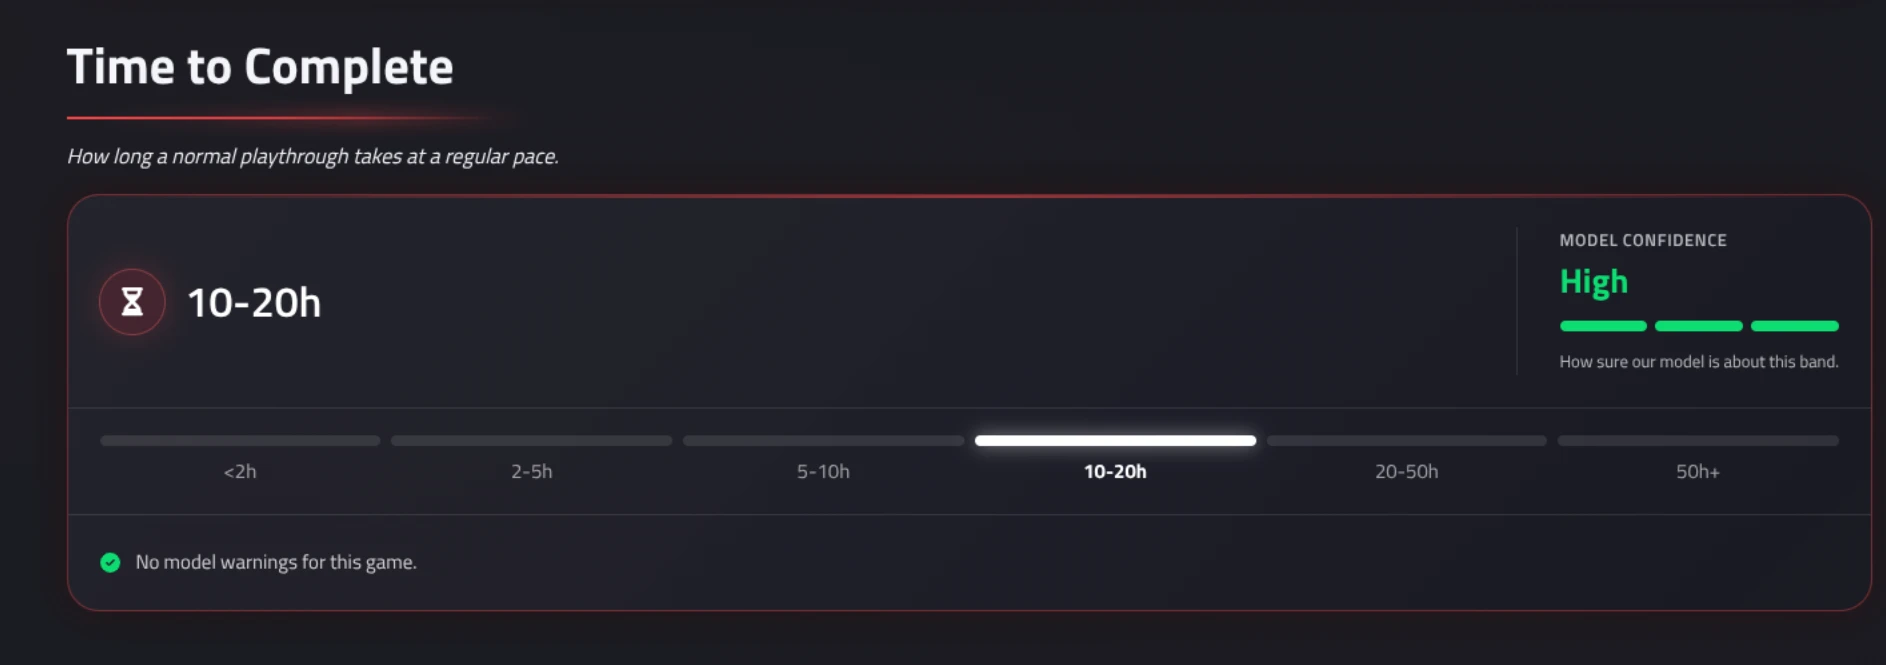
Game Oracle now shows completion times across the catalogue, using player-reported data from IGDB where available, and our own model estimates otherwise. We present these in six bands, from under two hours to 50 hours or more, alongside the source, model confidence, and relevant cautions. Games without sufficient data show the estimate as unavailable.
In Concept Compass, the new Gameplay Length Expectations section uses your comparable games to estimate an appropriate length for your concept. Closer matches carry more weight. You’ll see:
- An expected completion band and the range covering the middle half of comparable games.
- A chart showing how gameplay length varies across your competitors.
- Confidence and explanations of uncertainty, including limited evidence, widely varying lengths or games designed for ongoing play.
This gives you a starting point for scoping content and estimating production costs. You can consider the environments, encounters, writing, progression or replayable systems needed to support that experience, then compare your budget with Concept Compass’s sales and revenue projections.
Gameplay hours don’t translate directly into development hours: a short, densely authored experience can cost more to produce than a longer game built around reusable systems. But understanding the typical length of comparable games helps you make those assumptions explicit and judge whether the scope, cost and potential return make sense together.
Addressing Recency Bias in Concept Compass Projections
We’ve rebuilt Concept Compass’s projections in v7.1 to give you a more useful estimate of a concept’s potential in today’s Steam market.
Older games remain valuable comparisons, but they launched into different market conditions and have often accumulated years of sales. Treating their lifetime performance as directly comparable with a recent release can distort expectations.
The new algorithm accounts for both how closely a game matches your concept and how recently it launched. Closer matches carry more weight, while the recency component halves for every three years since release. Older games still contribute, but recent comparable releases have greater influence.
Crucially, we also adjust for how long each game has been on sale. The projections now estimate reviews, sales and gross revenue over the first two years on Steam. Using a growth curve derived from historical Steam review activity, we project younger games forward and scale older games back to an estimated two-year outcome. This avoids penalising recent releases simply because they’ve had less time to sell.
Games released less than 30 days ago are excluded from the performance forecast until there’s enough history to assess them. Upcoming games inform wishlist estimates separately.
We’ve also changed how the model handles limited evidence. It combines your comparable games with a Steam-wide baseline of commercial releases, applying the same age adjustments and recency weighting to both. When there are few usable comparables, the baseline carries more weight. The report shows that balance and the strength of the evidence behind it.
Results are presented as Low, Typical and High outcomes, with the median as the central estimate, so a handful of enormous hits don’t dominate an arithmetic average.
These forecasts assume a completed commercial release and a meaningful effort to reach players. They give you a clearer basis for comparing concepts, setting budgets and assessing potential returns, with greater emphasis on recent market evidence and a consistent timeframe for judging performance.
Pre- and Post-Launch Wishlists
We’ve also introduced pre-launch and post-launch wishlist estimates in v7.1, because when you’re researching a potential concept, when a game attracted interest matters.
A released game’s all-time wishlist estimate includes interest accumulated after launch. That could mean months or years of players discovering it through reviews, recommendations, updates and sales. Comparing that total with an upcoming game can give a misleading impression of how much interest it attracted before anyone could play it.
Often, what we really want to understand is how much of an audience a comparable game had built going into launch. That’s a more useful benchmark when exploring an idea’s potential and setting expectations for our own launch.
Game Oracle now distinguishes between:
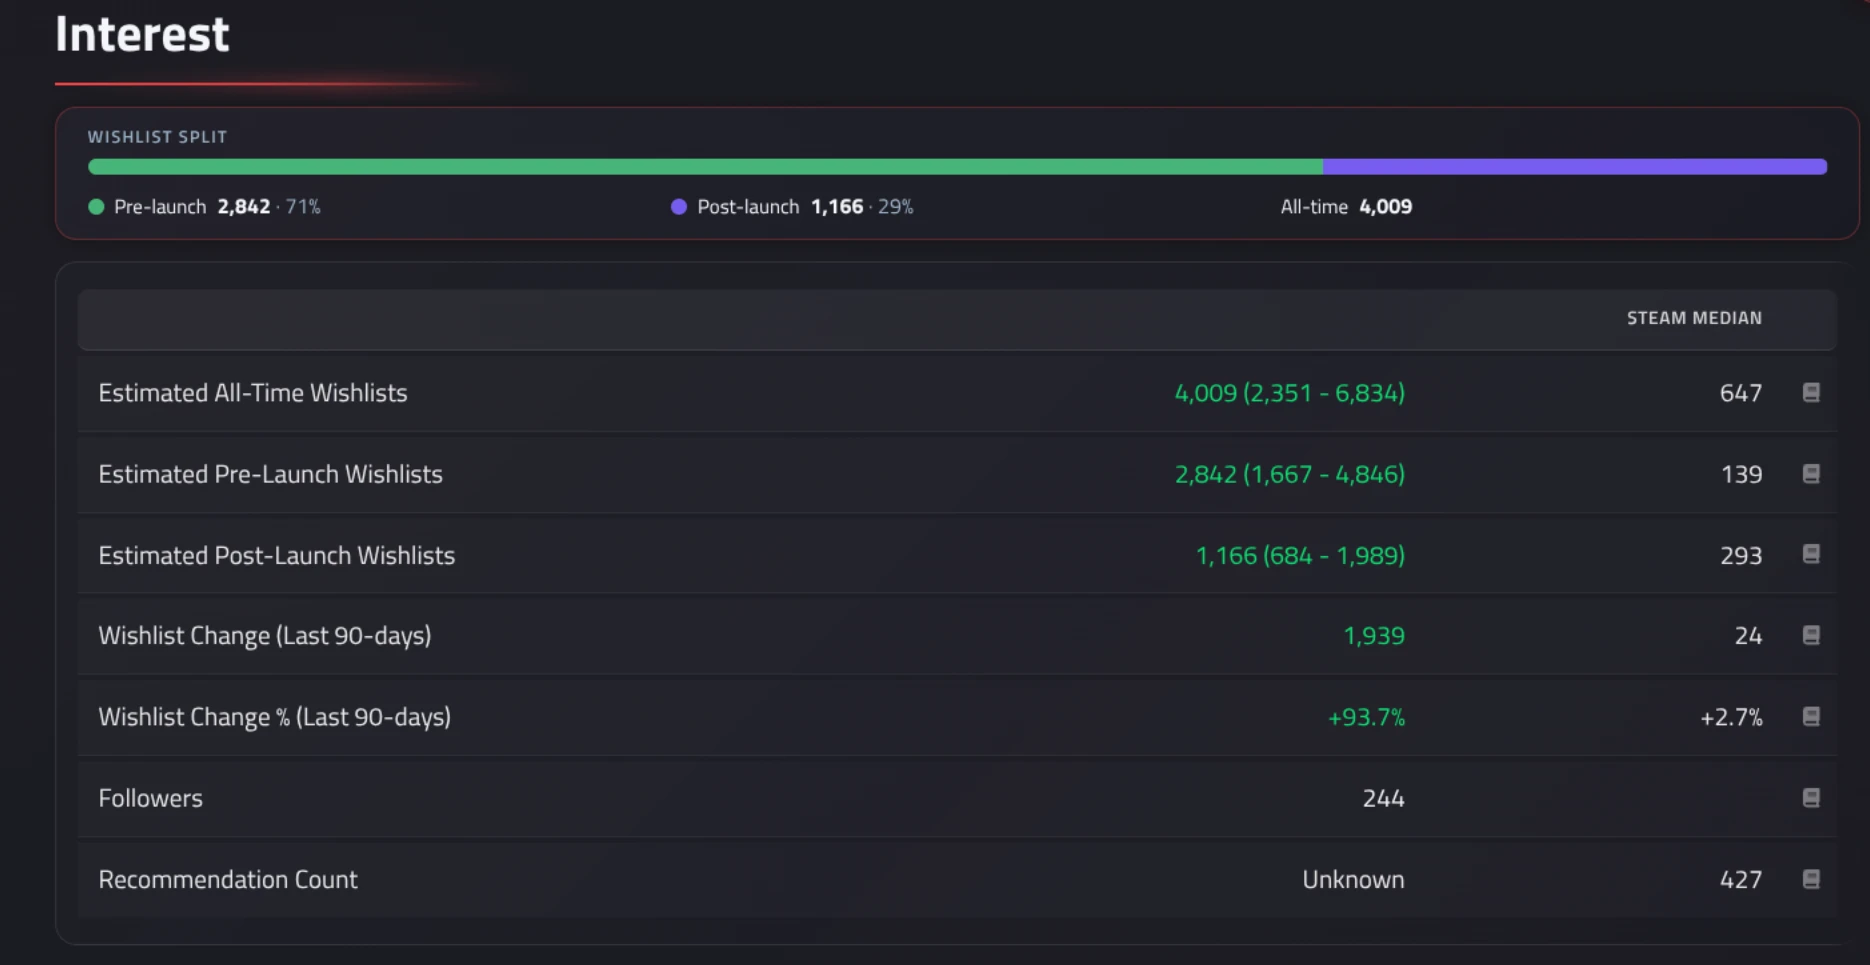
- Pre-launch wishlists: estimated wishlists at launch, or everything collected so far for an unreleased game.
- Post-launch wishlists: estimated wishlists added since release.
- All-time wishlists: the combined total.
You’ll find this breakdown on individual game pages, in Data Explorer’s table columns, and in Concept Compass’s competitor performance stats. Game Gap also shows separate pre-launch and all-time wishlist medians, while searches restricted to unreleased games in Data Explorer now highlight pre-launch wishlists in place of sales.
The split uses our historical Steam follower observations to estimate how much interest came before and after launch. Where we lack a suitable observation before release, we show the split as unavailable and retain the all-time estimate. For Early Access games, launch means the start of Early Access.
This gives us a clearer view of the audience a game brought into launch and the interest it built afterwards, making wishlist comparisons more useful when deciding which concepts deserve further investigation.
Steam News Feeds
We’ve added Steam News activity data, giving you more context about the games you’re researching and how regularly news about them appears.
Sales, reviews and wishlists tell us about a game’s performance, but it’s also useful to understand what’s happening around it now. Has its Steam news hub been active recently? Does news appear regularly, in occasional bursts, or has it been quiet for months?
Game Oracle now includes two measures:
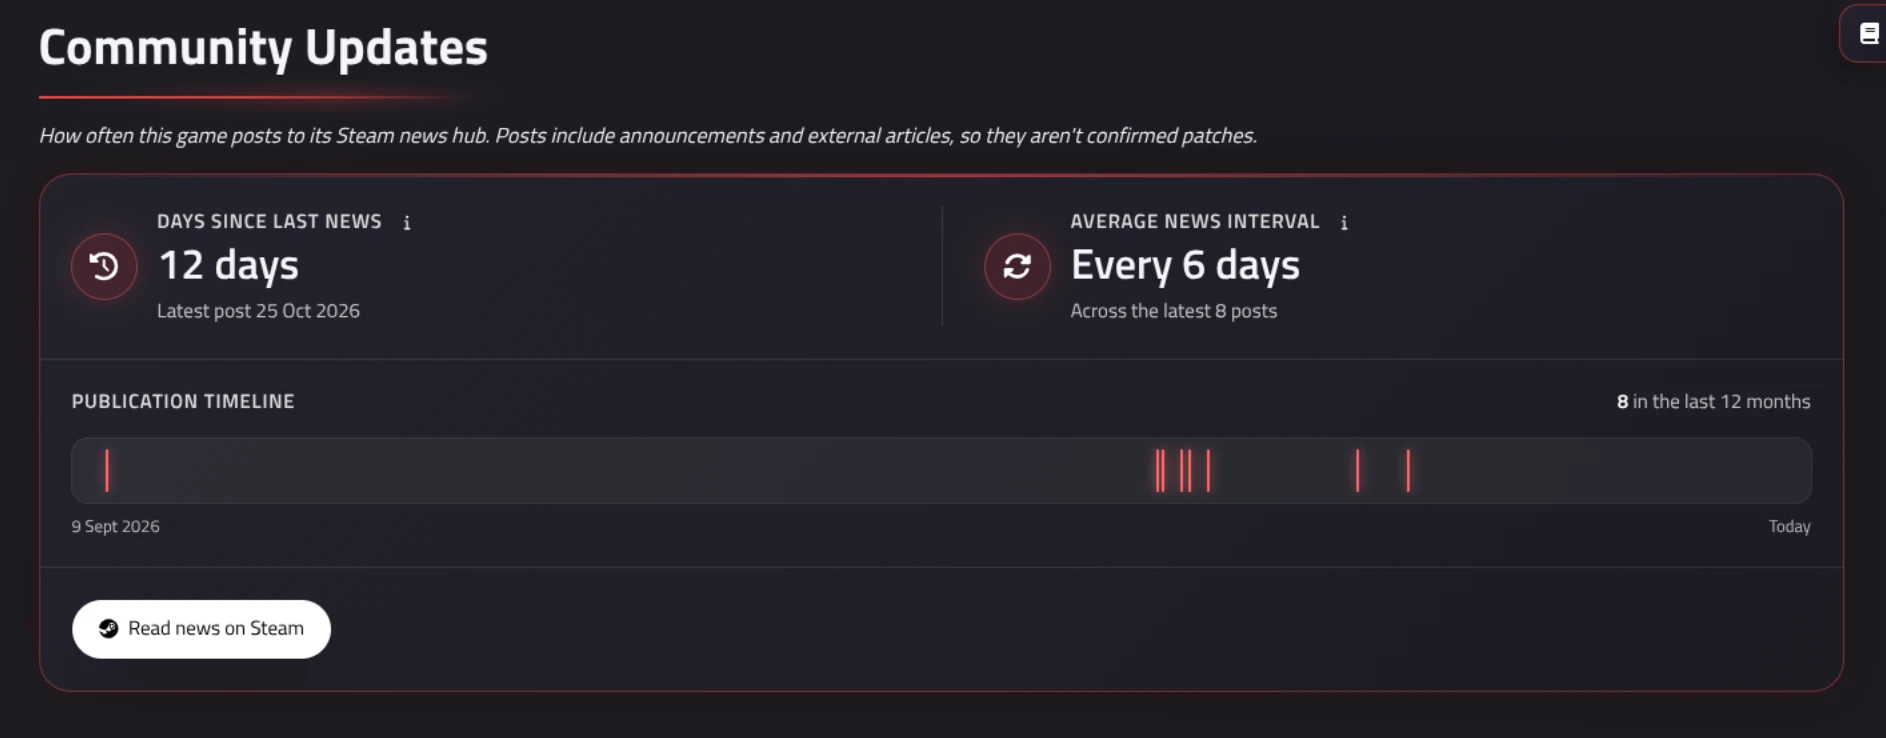
- Days Since Last News: how long it’s been since the latest post on the game’s Steam news hub.
- Average News Interval: the average number of days between its latest posts, using up to 50 entries.
On individual game pages, the Community Updates section shows both figures alongside a publication timeline, making bursts of activity and long quiet periods easy to spot. You can also open the game’s Steam news hub to investigate the posts themselves.
Subscribers can filter and sort by these measures in Data Explorer, add them to game tables, and explore them through scatter plots and histograms. For example, you can narrow a competitor search to games with news in the last month, or investigate titles whose news hubs have been quiet for a year. The data is also available through our Business API and MCP tools.
Steam’s news feeds include developer announcements, events and external press articles, so these figures measure news activity. A quiet feed alone doesn’t establish that a game has been abandoned, and frequent posts don’t necessarily mean frequent patches.
Together with player activity, reviews, and sales estimates, this adds another useful layer to competitor research and helps you identify games worth a closer look.
DLC & Package Info
We’ve also expanded game details pages with DLC and demo links, giving you a fuller picture of how a game is sold and what it offers beyond the base experience.
When researching comparable games, it’s useful to understand how developers package their work. What additional content do they offer? Can players try a demo?
The game page sidebar now includes:
- DLC: capsule artwork and a count of listed DLC, with the first three shown directly and a See all gallery for the rest.
- Demos and play-tests: direct links to associated demos on Steam.
This brings more of the game’s commercial context into your research, making it easier to investigate additional content, pricing and purchase choices alongside its performance data. These details are available across all account tiers.
TLDR: New Data, New Data Everywhere!
Game Oracle v7.1 is a "more data" release. It adds new ways to find opportunities, size scope, and judge competitors.
- Game Gap: Proven Pioneers & Missed Opportunities. Two new lists cover distinctive games that don't fit a market segment. Pioneers who found their audience and earned strong reviews. Missed Opportunities who drew players but got weaker reviews. Each game has a report on its hook, player feedback, marketing and development challenges. The reports also look at its 200 most similar games.
- Time-to-complete estimates. Every game gets a completion band, from under 2 hours to 50+ hours. The data comes from IGDB where available, and from our model otherwise. Concept Compass has a new Gameplay Length Expectations section to help you scope content and cost.
- Concept Compass projections rebuilt. Closer matches and more recent releases now carry more weight. Recency weight halves every 3 years. Every game is normalised to its first two years on Steam, so newer games aren't penalised for having had less time to sell. Sparse evidence is blended with a Steam-wide baseline. Results show as Low, Typical and High outcomes, centred on the median.
- Pre- and post-launch wishlists. Wishlists are now split into pre-launch, post-launch and all-time. You can see the split on game pages, in Data Explorer, in Concept Compass and in Game Gap. Where we lack the data to split them, the all-time figure is shown.
- Steam News feeds. Two new measures, Days Since Last News and Average News Interval, show how active a game's news hub is. Subscribers can filter, sort and chart them in Data Explorer. They're also available via the Business API and MCP tools.
- DLC & package info. Game pages now show DLC, play-tests, and demo links. This is available on all tiers.